I’m not breaking any news here when I tell you that mobile is exploding. Smart phone sales have overtaken sales of PCs. There are nearly a billion smartphones worldwide. 10% of all web traffic now comes form mobile devices.
This is all important stuff for us to follow. But as big of a deal as these overall industry trends are, at the Brick Factory it is more important for us to understand what is going on in our own world of non-profits and advocacy groups. How is the move towards mobile impacting our clients?
In an effort to answer that question, we took a detailed look at how mobile usage of the websites we manage (65+ sites) is evolving. We did this by comparing accesses from mobiles devices (defined as smartphones and tablets) in February 2010 to data from February 2011 and February 2012. While we can’t publicly release all of our findings, we did want to share some aggregate data.
Overall Mobile Traffic
As the chart below shows, the percentage of site traffic from mobile devices has increased dramatically over the last two years. Mobile traffic to the sites we looked at doubled from from 2010 to 2011, and then again from 2011 to 2012. In February 2012, 8.8% of all traffic came from mobile devices. This is pretty consistent with overall industry trends, which estimate that 10% of all traffic comes from mobile.
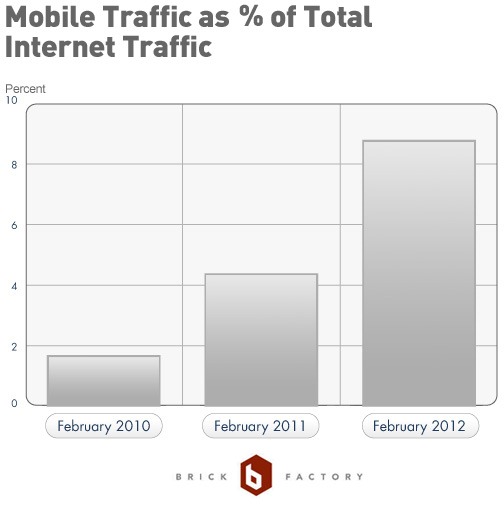
In analyzing the data, a critical point is that desktop traffic did not drop. Overall traffic and desktop traffic increased form year to year. Mobile traffic just increased at a higher rate. This is important, as, at least for our clients, mobile traffic isn’t taking away from desktop traffic. It is helping to expand the audience for our sites.
Browsers
For this study we used Google Analytics definition of mobile, which counts the iPad as a mobile device. The chart below shows the top mobile browsers for the sites we manage for 2010, 2011 and 2012.
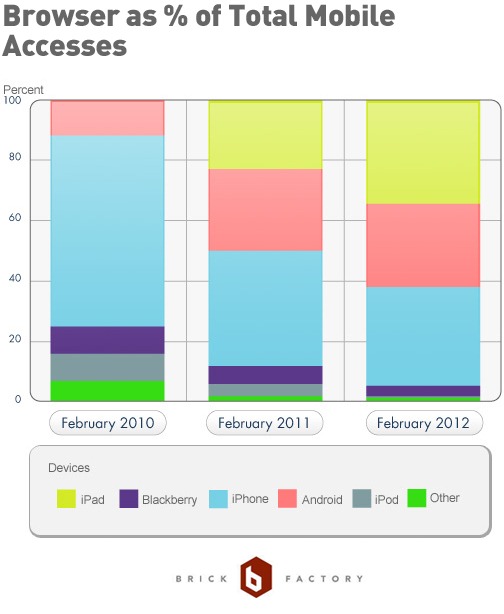
Here is another view of the data which makes it easier to see how things have changed over time.
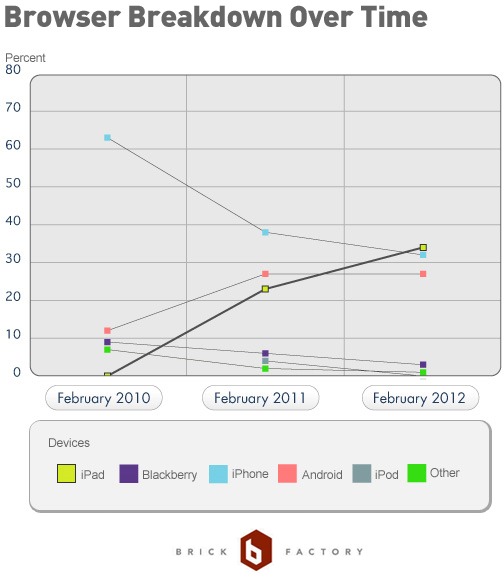
The story hear is that Android, iPhone and iPad are the dominant players. This consolidation makes things a bit easier for developers like us. Being able to focus on a few big devices/platforms makes it simpler for us to develop solutions that work on nearly all devices.
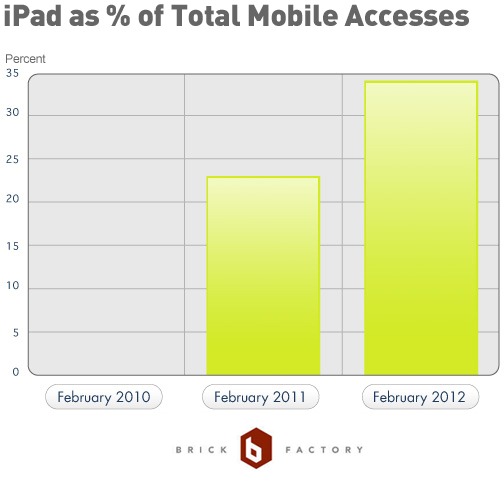
As you can see from the data, the introduction of the iPad has had a huge impact and is really what is driving the growth in our mobile stats. In two years the iPad has gone from not existing to a 35% mobile browser market share. We really haven’t seen much traffic yet from other tablet devises. This is important to understand as you plot your mobile strategy, as designing your website to work on an iPad is a much different task than designing for iPhone or Android.
Site Comparison
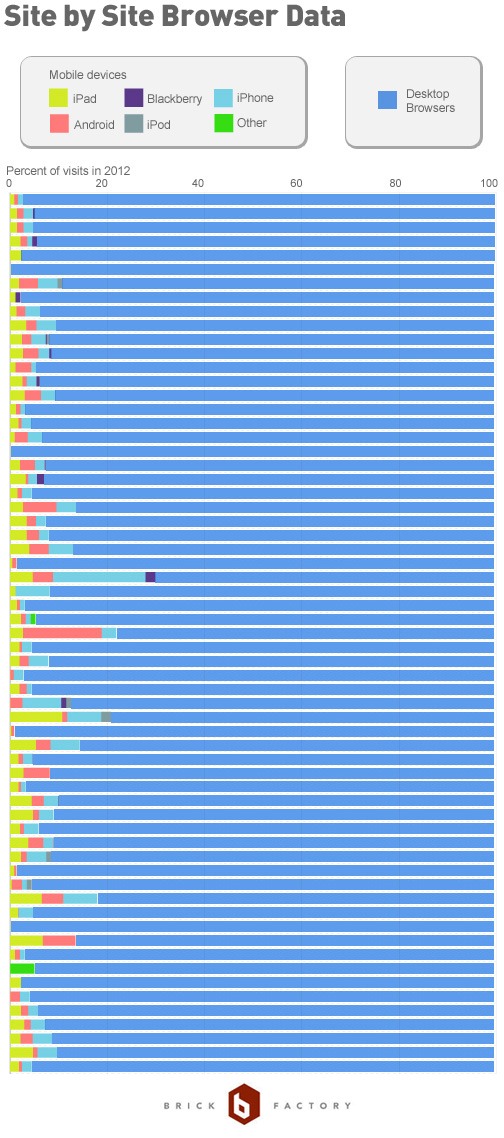
The percentage of visitors accessing from mobile devices varied dramatically from site to site. For some sites, 25% of users came from mobile devices while others only saw as little as 2% coming from mobile. Not surprisingly, sites with a news focus tended to attract a higher percentage of mobile users than more static sites. Sites with mobile friendly designs also attracted more mobile visitors than sites without.
The chart below shows the percentage of accesses for all of the sites we looked at. Each row represents a site.
Bottom Line
Our traffic data shows that mobile browsing has increased dramatically over the last few years. The data for the sites we manage is in line with the overall industry trends. When we look at this data in 2013 we expect mobile accesses to have doubled again and to represent 15-20% of all site traffic.
As a digital agency, the ramifications for us are pretty clear. Making the sites we build mobile friendly is no longer just an option to consider. It is a requirement.
Thanks to Ashley Montague for compiling the data for this blog post and Freddy Trejo for the awesome graphs.
Sign up today to have our latest posts delivered straight to your inbox.