During the UN Climate Change Conference held in Copenhagen this week, Google unveiled an advanced Google Earth prototype that allows satellite imagery to show and measure the progression of deforestation in regions around the world. Google teamed up with software experts Greg Asner, from Carnegie Institution for Science, and Carlos Souza, from Imazon (both institutions with forest data programs used in Latin America) and created a “cloud-based computing” technology that gathers all satellite imagery data for a region and displays them in a user-friendly format.
Google offers before and after stills of the technology on their blog:

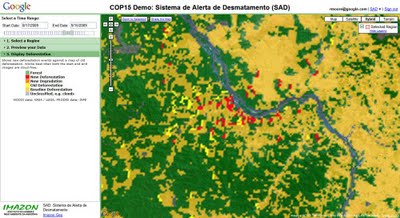
AFTER: Deforestation in Mato Grosso, Brazil (Augustin 2009-September 2009) using SAD technology created by Carolos Souza. Red signifies recent deforestation.

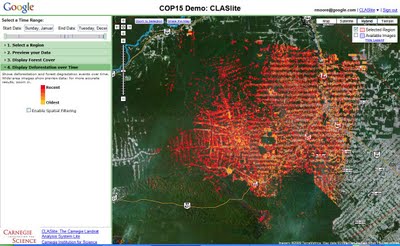
AFTER: Deforestation in Rondonia, Brazil (1986-2008) using CLASlite technology created by Greg Asner. Progression of deforestation color-coded
As stated on the Google blog:
“On a top-of-the-line desktop computer, it can take days or weeks to analyze deforestation over the Amazon. Using our cloud-based computing power, we can reduce that time to seconds. Being able to detect illegal logging activities faster can help support local law enforcement and prevent further deforestation from happening.”
Google hopes to release this technology to the public during the coming year.
If you’d like to learn more about how current Google Earth technologies can promote environmental awareness, please take a look at the video Bivings produced for Wild Australia. Using Google Earth video and b-roll footage, we created a short video showcasing the ecology of the Southwest Marine region of Australia.
Sign up today to have our latest posts delivered straight to your inbox.